箱形图常用于表示一组给定数据的分布特征,或者用于发现异常值。异常值是由于某种原因造成的数据中出现的统计上过大或过小的值,将它们纳入数据分析会影响分析结果。箱形图有简单箱形图、多色简单箱形图、渐变多色简单箱形图、复合箱形图、散点箱形图等多种类型,本节将逐一实现。[大谦Excel,dqexcel点com]
箱形图简介
常见箱形图如图5-4所示,由中间的矩形箱体、箱体中的横线、箱体上下的触须和表示异常值的点标记组合而成。矩形箱体的上边缘对应给定数据的75%分位数,下边缘对应给定数据的25%分位数,中间横线表示中值,即50%分位数。图中上触须和下触须的位置分别表示75%分位数+1.5×IQR和25%分位数-1.5×IQR,其中IQR表示75%分位数和25%分位数的差,也称为内四分极差。触须以外的数据点被判断为异常值,用点标记表示。图5-4中发现了2组数据中共3个异常值。
注意,上触须和下触须的位置不能高于最大值或低于最小值,所以,绘箱形图时,如果75%分位数+1.5×IQR的计算结果大于最大值,则上触须的位置取为最大值;如果25%分位数-1.5×IQR的计算结果小于最小值,则下触须的位置取为最小值。
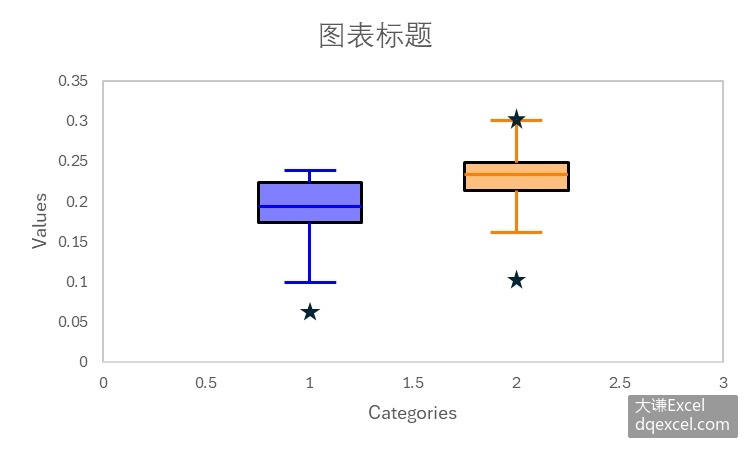
图5-4 用箱形图查找异常值
根据箱形图可以探查数据的分布特征。如果箱体长度比较大,说明数据比较分散;长度小则说明数据紧凑。表示中值的横线位于箱体中间位置时,说明数据呈正态分布,反之则呈偏态分布。
简单箱形图
简单箱形图用一组箱形表示一组数据的分布特征,如图5-5所示。从图中可以查看单组数据的分布状态,以及各组数据之间的整体波动状态。
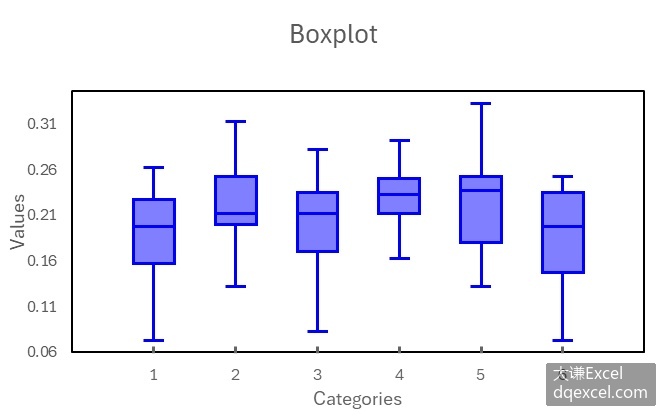
图5-6 用自定义函数绘制简单箱形图
使用Python xlwings编程,无法用Shapes对象的AddChart2函数直接创建箱形图。考虑自己绘制箱形图。完整代码见:Samples->ch08 统计图表->06 简单箱形图-自定义->py.py。
Sub DrawBoxplot(dblD() As Double, intN As Long, cht As Chart, intR As Integer, intG As Integer, intB As Integer, dblX As Double, dblW As Double, bolGradient As Boolean)
  Dim dblP25 As Double
  Dim dblP50 As Double
  Dim dblP75 As Double
  Dim dblIQR As Double
  Dim dblPU As Double
  Dim dblPL As Double
  Dim dblMin As Double
  Dim dblMax As Double
  dblP25 = Application.WorksheetFunction.Percentile(dblD, 0.25)
  dblP50 = Application.WorksheetFunction.Percentile(dblD, 0.5)
  dblP75 = Application.WorksheetFunction.Percentile(dblD, 0.75)
  dblIQR = dblP75 - dblP25
  dblPU = dblP75 + 1.5 * dblIQR
  dblPL = dblP25 - 1.5 * dblIQR
  dblMin = Application.WorksheetFunction.Min(dblD)
  dblMax = Application.WorksheetFunction.Max(dblD)
  If dblMin > dblPL Then dblPL = dblMin
  If dblMax < dblPU Then dblPU = dblMax
  Dim sngP(1 To 5, 1 To 2) As Single
  sngP(1, 1) = ShapeX(cht, dblX - dblW / 2)
  sngP(1, 2) = ShapeY(cht, dblP25)
  sngP(2, 1) = ShapeX(cht, dblX + dblW / 2)
  sngP(2, 2) = ShapeY(cht, dblP25)
  sngP(3, 1) = ShapeX(cht, dblX + dblW / 2)
  sngP(3, 2) = ShapeY(cht, dblP75)
  sngP(4, 1) = ShapeX(cht, dblX - dblW / 2)
  sngP(4, 2) = ShapeY(cht, dblP75)
  sngP(5, 1) = ShapeX(cht, dblX - dblW / 2)
  sngP(5, 2) = ShapeY(cht, dblP25)
  Dim shp As Shape
  Set shp = cht.Shapes.AddPolyline(sngP)
  If bolGradient Then
    shp.Fill.ForeColor.RGB = RGB(255, 255, 255)
    shp.Fill.TwoColorGradient msoGradientHorizontal, 1
    shp.Fill.BackColor.RGB = RGB(intR, intG, intB)
    shp.Line.ForeColor.RGB = RGB(intR, intG, intB)
    shp.Line.Weight = 1.5
  Else
    shp.Fill.ForeColor.RGB = RGB(intR, intG, intB)
    shp.Fill.Transparency = 0.5
    shp.Line.ForeColor.RGB = RGB(intR, intG, intB)
    shp.Line.Weight = 1.5
  End If

  Dim shp2 As Shape
  Dim bx As Double
  Dim by As Double
  Dim ex As Double
  Dim ey As Double
  bx = ShapeX(cht, dblX - dblW / 2)
  ex = ShapeX(cht, dblX + dblW / 2)
  by = ShapeY(cht, dblP50)
  ey = ShapeY(cht, dblP50)
  Set shp2 = cht.Shapes.AddLine(bx, by, ex, ey)
  shp2.Line.Weight = 1.5
  shp2.Line.ForeColor.RGB = RGB(intR, intG, intB)
  bx = ShapeX(cht, dblX)
  ex = ShapeX(cht, dblX)
  by = ShapeY(cht, dblP75)
  ey = ShapeY(cht, dblPU)
  Set shp2 = cht.Shapes.AddLine(bx, by, ex, ey)
  shp2.Line.Weight = 1.5
  shp2.Line.ForeColor.RGB = RGB(intR, intG, intB)

  bx = ShapeX(cht, CDbl(dblX))
  ex = ShapeX(cht, CDbl(dblX))
  by = ShapeY(cht, dblP25)
  ey = ShapeY(cht, dblPL)
  Set shp2 = cht.Shapes.AddLine(bx, by, ex, ey)
  shp2.Line.Weight = 1.5
  shp2.Line.ForeColor.RGB = RGB(intR, intG, intB)

  bx = ShapeX(cht, CDbl(dblX - dblW / 4))
  ex = ShapeX(cht, CDbl(dblX + dblW / 4))
  by = ShapeY(cht, dblPU)
  ey = ShapeY(cht, dblPU)
  Set shp2 = cht.Shapes.AddLine(bx, by, ex, ey)
  shp2.Line.Weight = 1.5
  shp2.Line.ForeColor.RGB = RGB(intR, intG, intB)

  bx = ShapeX(cht, CDbl(dblX - dblW / 4))
  ex = ShapeX(cht, CDbl(dblX + dblW / 4))
  by = ShapeY(cht, dblPL)
  ey = ShapeY(cht, dblPL)
  Set shp2 = cht.Shapes.AddLine(bx, by, ex, ey)
  shp2.Line.Weight = 1.5
  shp2.Line.ForeColor.RGB = RGB(intR, intG, intB)

  Dim xx As Double
  Dim yy As Double
  Dim ww As Double
  Dim hh As Double
  For lngI = 1 To intN
    xx = ShapeX(cht, CDbl(dblX - dblW / 20))
    yy = ShapeY(cht, dblD(lngI - 1))
    ww = cht.PlotArea.InsideWidth / (cht.Axes(1).MaximumScale - cht.Axes(1).MinimumScale) * dblW / 10
    hh = ww
    If dblD(lngI - 1) > dblPU Or dblD(lngI - 1) < dblPL Then
      Set shp2 = cht.Shapes.AddShape(92, xx, yy, ww, hh)
    End If
  Next
End Sub
多色简单箱形图
多色简单箱形图中每个箱形的颜色都不一样,如图5-7所示。这种箱形图在各种学术期刊中也很常见。
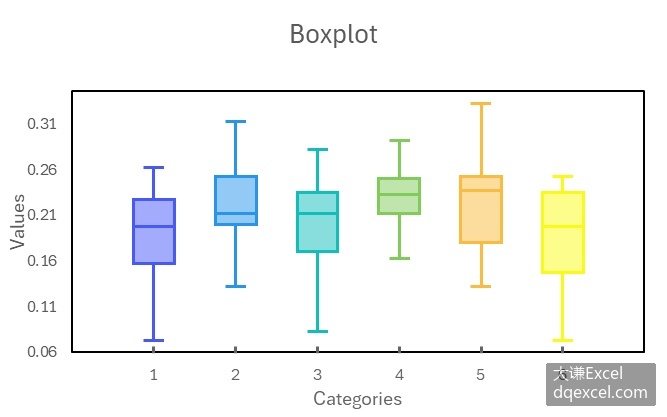
图5-7 多色简单箱形图
5.2.2小节最后介绍了自定义箱形图的方法,通过自定义,可以对箱形图有更多的控制。如下面代码所示,调用draw_boxplot函数绘制自定义箱形图时,为每个箱形指定不同的颜色。完整代码见:Samples->ch08 统计图表->07 多色简单箱形图->py.py。
Sub DrawBoxplot(dblD() As Double, intN As Long, cht As Chart, intR As Integer, intG As Integer, intB As Integer, dblX As Double, dblW As Double, bolGradient As Boolean)
  Dim dblP25 As Double
  Dim dblP50 As Double
  Dim dblP75 As Double
  Dim dblIQR As Double
  Dim dblPU As Double
  Dim dblPL As Double
  Dim dblMin As Double
  Dim dblMax As Double
  dblP25 = Application.WorksheetFunction.Percentile(dblD, 0.25)
  dblP50 = Application.WorksheetFunction.Percentile(dblD, 0.5)
  dblP75 = Application.WorksheetFunction.Percentile(dblD, 0.75)
  dblIQR = dblP75 - dblP25
  dblPU = dblP75 + 1.5 * dblIQR
  dblPL = dblP25 - 1.5 * dblIQR
  dblMin = Application.WorksheetFunction.Min(dblD)
  dblMax = Application.WorksheetFunction.Max(dblD)
  If dblMin > dblPL Then dblPL = dblMin
  If dblMax < dblPU Then dblPU = dblMax
  Dim sngP(1 To 5, 1 To 2) As Single
  sngP(1, 1) = ShapeX(cht, dblX - dblW / 2)
  sngP(1, 2) = ShapeY(cht, dblP25)
  sngP(2, 1) = ShapeX(cht, dblX + dblW / 2)
  sngP(2, 2) = ShapeY(cht, dblP25)
  sngP(3, 1) = ShapeX(cht, dblX + dblW / 2)
  sngP(3, 2) = ShapeY(cht, dblP75)
  sngP(4, 1) = ShapeX(cht, dblX - dblW / 2)
  sngP(4, 2) = ShapeY(cht, dblP75)
  sngP(5, 1) = ShapeX(cht, dblX - dblW / 2)
  sngP(5, 2) = ShapeY(cht, dblP25)
  Dim shp As Shape
  Set shp = cht.Shapes.AddPolyline(sngP)
  If bolGradient Then
    shp.Fill.ForeColor.RGB = RGB(255, 255, 255)
    shp.Fill.TwoColorGradient msoGradientHorizontal, 1
    shp.Fill.BackColor.RGB = RGB(intR, intG, intB)
    shp.Line.ForeColor.RGB = RGB(intR, intG, intB)
    shp.Line.Weight = 1.5
  Else
    shp.Fill.ForeColor.RGB = RGB(intR, intG, intB)
    shp.Fill.Transparency = 0.5
    shp.Line.ForeColor.RGB = RGB(intR, intG, intB)
    shp.Line.Weight = 1.5
  End If

  Dim shp2 As Shape
  Dim bx As Double
  Dim by As Double
  Dim ex As Double
  Dim ey As Double
  bx = ShapeX(cht, dblX - dblW / 2)
  ex = ShapeX(cht, dblX + dblW / 2)
  by = ShapeY(cht, dblP50)
  ey = ShapeY(cht, dblP50)
  Set shp2 = cht.Shapes.AddLine(bx, by, ex, ey)
  shp2.Line.Weight = 1.5
  shp2.Line.ForeColor.RGB = RGB(intR, intG, intB)
  bx = ShapeX(cht, dblX)
  ex = ShapeX(cht, dblX)
  by = ShapeY(cht, dblP75)
  ey = ShapeY(cht, dblPU)
  Set shp2 = cht.Shapes.AddLine(bx, by, ex, ey)
  shp2.Line.Weight = 1.5
  shp2.Line.ForeColor.RGB = RGB(intR, intG, intB)

  bx = ShapeX(cht, CDbl(dblX))
  ex = ShapeX(cht, CDbl(dblX))
  by = ShapeY(cht, dblP25)
  ey = ShapeY(cht, dblPL)
  Set shp2 = cht.Shapes.AddLine(bx, by, ex, ey)
  shp2.Line.Weight = 1.5
  shp2.Line.ForeColor.RGB = RGB(intR, intG, intB)

  bx = ShapeX(cht, CDbl(dblX - dblW / 4))
  ex = ShapeX(cht, CDbl(dblX + dblW / 4))
  by = ShapeY(cht, dblPU)
  ey = ShapeY(cht, dblPU)
  Set shp2 = cht.Shapes.AddLine(bx, by, ex, ey)
  shp2.Line.Weight = 1.5
  shp2.Line.ForeColor.RGB = RGB(intR, intG, intB)

  bx = ShapeX(cht, CDbl(dblX - dblW / 4))
  ex = ShapeX(cht, CDbl(dblX + dblW / 4))
  by = ShapeY(cht, dblPL)
  ey = ShapeY(cht, dblPL)
  Set shp2 = cht.Shapes.AddLine(bx, by, ex, ey)
  shp2.Line.Weight = 1.5
  shp2.Line.ForeColor.RGB = RGB(intR, intG, intB)

  Dim xx As Double
  Dim yy As Double
  Dim ww As Double
  Dim hh As Double
  For lngI = 1 To intN
    xx = ShapeX(cht, CDbl(dblX - dblW / 20))
    yy = ShapeY(cht, dblD(lngI - 1))
    ww = cht.PlotArea.InsideWidth / (cht.Axes(1).MaximumScale - cht.Axes(1).MinimumScale) * dblW / 10
    hh = ww
    If dblD(lngI - 1) > dblPU Or dblD(lngI - 1) < dblPL Then
      Set shp2 = cht.Shapes.AddShape(92, xx, yy, ww, hh)
    End If
  Next
End Sub
运行代码,生成类似图5-7的多色简单箱形图。
水平方向多色简单箱形图
常需要绘制水平方向的箱形图,如图5-8所示。

图5-8 水平多色简单箱形图
编写draw_boxplot_h函数绘制水平多色简单箱形图。完整代码见:Samples->ch08 统计图表->08 多色简单箱形图-水平->py.py。
Sub DrawBoxplotH(dblD() As Double, intN As Long, cht As Chart, intR As Integer, intG As Integer, intB As Integer, dblX As Double, dblW As Double, bolGradient As Boolean)
  Dim dblP25 As Double
  Dim dblP50 As Double
  Dim dblP75 As Double
  Dim dblIQR As Double
  Dim dblPU As Double
  Dim dblPL As Double
  Dim dblMin As Double
  Dim dblMax As Double
  dblP25 = Application.WorksheetFunction.Percentile(dblD, 0.25)
  dblP50 = Application.WorksheetFunction.Percentile(dblD, 0.5)
  dblP75 = Application.WorksheetFunction.Percentile(dblD, 0.75)
  dblIQR = dblP75 - dblP25
  dblPU = dblP75 + 1.5 * dblIQR
  dblPL = dblP25 - 1.5 * dblIQR
  dblMin = Application.WorksheetFunction.Min(dblD)
  dblMax = Application.WorksheetFunction.Max(dblD)
  If dblMin > dblPL Then dblPL = dblMin
  If dblMax < dblPU Then dblPU = dblMax
  Dim sngP(1 To 5, 1 To 2) As Single
  sngP(1, 2) = ShapeY(cht, dblX + dblW / 2)
  sngP(1, 1) = ShapeX(cht, dblP25)
  sngP(2, 2) = ShapeY(cht, dblX - dblW / 2)
  sngP(2, 1) = ShapeX(cht, dblP25)
  sngP(3, 2) = ShapeY(cht, dblX - dblW / 2)
  sngP(3, 1) = ShapeX(cht, dblP75)
  sngP(4, 2) = ShapeY(cht, dblX + dblW / 2)
  sngP(4, 1) = ShapeX(cht, dblP75)
  sngP(5, 2) = sngP(1, 2)
  sngP(5, 1) = sngP(1, 1)
  Dim shp As Shape
  Set shp = cht.Shapes.AddPolyline(sngP)
  If bolGradient Then
    shp.Fill.ForeColor.RGB = RGB(255, 255, 255)
    shp.Fill.TwoColorGradient msoGradientVertical, 1
    shp.Fill.BackColor.RGB = RGB(intR, intG, intB)
    shp.Line.ForeColor.RGB = RGB(intR, intG, intB)
    shp.Line.Weight = 1.5
  Else
    shp.Fill.ForeColor.RGB = RGB(intR, intG, intB)
    shp.Fill.Transparency = 0.5
    shp.Line.ForeColor.RGB = RGB(intR, intG, intB)
    shp.Line.Weight = 1.5
  End If

  Dim shp2 As Shape
  Dim bx As Double
  Dim by As Double
  Dim ex As Double
  Dim ey As Double
  by = ShapeY(cht, dblX - dblW / 2)
  ey = ShapeY(cht, dblX + dblW / 2)
  bx = ShapeX(cht, dblP50)
  ex = ShapeX(cht, dblP50)
  Set shp2 = cht.Shapes.AddLine(bx, by, ex, ey)
  shp2.Line.Weight = 1.5
  shp2.Line.ForeColor.RGB = RGB(intR, intG, intB)
  by = ShapeY(cht, dblX)
  ey = ShapeY(cht, dblX)
  bx = ShapeX(cht, dblP75)
  ex = ShapeX(cht, dblPU)
  Set shp2 = cht.Shapes.AddLine(bx, by, ex, ey)
  shp2.Line.Weight = 1.5
  shp2.Line.ForeColor.RGB = RGB(intR, intG, intB)

  by = ShapeY(cht, CDbl(dblX))
  ey = ShapeY(cht, CDbl(dblX))
  bx = ShapeX(cht, dblP25)
  ex = ShapeX(cht, dblPL)
  Set shp2 = cht.Shapes.AddLine(bx, by, ex, ey)
  shp2.Line.Weight = 1.5
  shp2.Line.ForeColor.RGB = RGB(intR, intG, intB)

  by = ShapeY(cht, CDbl(dblX - dblW / 4))
  ey = ShapeY(cht, CDbl(dblX + dblW / 4))
  bx = ShapeX(cht, dblPU)
  ex = ShapeX(cht, dblPU)
  Set shp2 = cht.Shapes.AddLine(bx, by, ex, ey)
  shp2.Line.Weight = 1.5
  shp2.Line.ForeColor.RGB = RGB(intR, intG, intB)

  by = ShapeY(cht, CDbl(dblX - dblW / 4))
  ey = ShapeY(cht, CDbl(dblX + dblW / 4))
  bx = ShapeX(cht, dblPL)
  ex = ShapeX(cht, dblPL)
  Set shp2 = cht.Shapes.AddLine(bx, by, ex, ey)
  shp2.Line.Weight = 1.5
  shp2.Line.ForeColor.RGB = RGB(intR, intG, intB)

  Dim xx As Double
  Dim yy As Double
  Dim ww As Double
  Dim hh As Double
  For intI = 1 To intN
    yy = ShapeY(cht, CDbl(dblX - dblW / 20))
    xx = ShapeX(cht, dblD(intI - 1))
    hh = cht.PlotArea.InsideWidth / (cht.Axes(1).MaximumScale - cht.Axes(1).MinimumScale) * dblW / 10
    ww = hh
    If dblD(intI - 1) > dblPU Or dblD(intI - 1) < dblPL Then
      Set shp2 = cht.Shapes.AddShape(92, xx, yy, ww, hh)
    End If
  Next
End Sub
单渐变色简单箱形图
多色简单箱形图中,虽然每个箱形的颜色不同,但每个箱形是单色的。本小节开始介绍如何绘制用渐变色填充箱体的箱形图。首先介绍比较简单的情况,即用相同的渐变色填充各箱体的情况。

图5-10 自定义单渐变色简单箱形图
draw_boxplot函数中对箱体进行渐变色填充的代码如下所示,使用了FillFormat对象的TwoColorGradient方法。用grad参数指定是否使用渐变色进行填充。完整代码见:Samples->ch08 统计图表->09 单渐变色简单箱形图->py.py。
Sub DrawBoxplot(dblD() As Double, intN As Long, cht As Chart, intR As Integer, intG As Integer, intB As Integer, dblX As Double, dblW As Double, bolGradient As Boolean)
  Dim dblP25 As Double
  Dim dblP50 As Double
  Dim dblP75 As Double
  Dim dblIQR As Double
  Dim dblPU As Double
  Dim dblPL As Double
  Dim dblMin As Double
  Dim dblMax As Double
  dblP25 = Application.WorksheetFunction.Percentile(dblD, 0.25)
  dblP50 = Application.WorksheetFunction.Percentile(dblD, 0.5)
  dblP75 = Application.WorksheetFunction.Percentile(dblD, 0.75)
  dblIQR = dblP75 - dblP25
  dblPU = dblP75 + 1.5 * dblIQR
  dblPL = dblP25 - 1.5 * dblIQR
  dblMin = Application.WorksheetFunction.Min(dblD)
  dblMax = Application.WorksheetFunction.Max(dblD)
  If dblMin > dblPL Then dblPL = dblMin
  If dblMax < dblPU Then dblPU = dblMax
  Dim sngP(1 To 5, 1 To 2) As Single
  sngP(1, 1) = ShapeX(cht, dblX - dblW / 2)
  sngP(1, 2) = ShapeY(cht, dblP25)
  sngP(2, 1) = ShapeX(cht, dblX + dblW / 2)
  sngP(2, 2) = ShapeY(cht, dblP25)
  sngP(3, 1) = ShapeX(cht, dblX + dblW / 2)
  sngP(3, 2) = ShapeY(cht, dblP75)
  sngP(4, 1) = ShapeX(cht, dblX - dblW / 2)
  sngP(4, 2) = ShapeY(cht, dblP75)
  sngP(5, 1) = ShapeX(cht, dblX - dblW / 2)
  sngP(5, 2) = ShapeY(cht, dblP25)
  Dim shp As Shape
  Set shp = cht.Shapes.AddPolyline(sngP)
  If bolGradient Then
    shp.Fill.ForeColor.RGB = RGB(255, 255, 255)
    shp.Fill.TwoColorGradient msoGradientHorizontal, 1
    shp.Fill.BackColor.RGB = RGB(intR, intG, intB)
    shp.Line.ForeColor.RGB = RGB(intR, intG, intB)
    shp.Line.Weight = 1.5
  Else
    shp.Fill.ForeColor.RGB = RGB(intR, intG, intB)
    shp.Fill.Transparency = 0.5
    shp.Line.ForeColor.RGB = RGB(intR, intG, intB)
    shp.Line.Weight = 1.5
  End If

  Dim shp2 As Shape
  Dim bx As Double
  Dim by As Double
  Dim ex As Double
  Dim ey As Double
  bx = ShapeX(cht, dblX - dblW / 2)
  ex = ShapeX(cht, dblX + dblW / 2)
  by = ShapeY(cht, dblP50)
  ey = ShapeY(cht, dblP50)
  Set shp2 = cht.Shapes.AddLine(bx, by, ex, ey)
  shp2.Line.Weight = 1.5
  shp2.Line.ForeColor.RGB = RGB(intR, intG, intB)
  bx = ShapeX(cht, dblX)
  ex = ShapeX(cht, dblX)
  by = ShapeY(cht, dblP75)
  ey = ShapeY(cht, dblPU)
  Set shp2 = cht.Shapes.AddLine(bx, by, ex, ey)
  shp2.Line.Weight = 1.5
  shp2.Line.ForeColor.RGB = RGB(intR, intG, intB)

  bx = ShapeX(cht, CDbl(dblX))
  ex = ShapeX(cht, CDbl(dblX))
  by = ShapeY(cht, dblP25)
  ey = ShapeY(cht, dblPL)
  Set shp2 = cht.Shapes.AddLine(bx, by, ex, ey)
  shp2.Line.Weight = 1.5
  shp2.Line.ForeColor.RGB = RGB(intR, intG, intB)

  bx = ShapeX(cht, CDbl(dblX - dblW / 4))
  ex = ShapeX(cht, CDbl(dblX + dblW / 4))
  by = ShapeY(cht, dblPU)
  ey = ShapeY(cht, dblPU)
  Set shp2 = cht.Shapes.AddLine(bx, by, ex, ey)
  shp2.Line.Weight = 1.5
  shp2.Line.ForeColor.RGB = RGB(intR, intG, intB)

  bx = ShapeX(cht, CDbl(dblX - dblW / 4))
  ex = ShapeX(cht, CDbl(dblX + dblW / 4))
  by = ShapeY(cht, dblPL)
  ey = ShapeY(cht, dblPL)
  Set shp2 = cht.Shapes.AddLine(bx, by, ex, ey)
  shp2.Line.Weight = 1.5
  shp2.Line.ForeColor.RGB = RGB(intR, intG, intB)

  Dim xx As Double
  Dim yy As Double
  Dim ww As Double
  Dim hh As Double
  For lngI = 1 To intN
    xx = ShapeX(cht, CDbl(dblX - dblW / 20))
    yy = ShapeY(cht, dblD(lngI - 1))
    ww = cht.PlotArea.InsideWidth / (cht.Axes(1).MaximumScale - cht.Axes(1).MinimumScale) * dblW / 10
    hh = ww
    If dblD(lngI - 1) > dblPU Or dblD(lngI - 1) < dblPL Then
      Set shp2 = cht.Shapes.AddShape(92, xx, yy, ww, hh)
    End If
  Next
End Sub
运行代码,生成类似图5-10的单渐变色简单箱形图。
多渐变色简单箱形图
多渐变色简单箱形图用不同的渐变色填充各箱形的箱体,如图5-11所示。
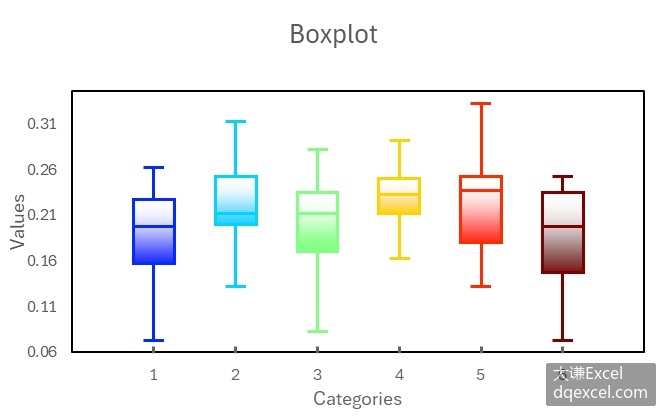
图5-11 多渐变色简单箱形图
用Python xlwings绘制多渐变色简单箱形图时,用draw_boxplot函数绘制渐变色填充的箱形,并给每个箱形指定不同的颜色即可。完整代码见:Samples->ch08 统计图表->10 多渐变色简单箱形图->py.py。
Sub DrawBoxplot(dblD() As Double, intN As Integer, cht As Chart, intR As Integer, intG As Integer, intB As Integer, dblX As Double, dblW As Double, bolGradient As Boolean)
  Dim dblP25 As Double
  Dim dblP50 As Double
  Dim dblP75 As Double
  Dim dblIQR As Double
  Dim dblPU As Double
  Dim dblPL As Double
  Dim dblMin As Double
  Dim dblMax As Double
  dblP25 = Application.WorksheetFunction.Percentile(dblD, 0.25)
  dblP50 = Application.WorksheetFunction.Percentile(dblD, 0.5)
  dblP75 = Application.WorksheetFunction.Percentile(dblD, 0.75)
  dblIQR = dblP75 - dblP25
  dblPU = dblP75 + 1.5 * dblIQR
  dblPL = dblP25 - 1.5 * dblIQR
  dblMin = Application.WorksheetFunction.Min(dblD)
  dblMax = Application.WorksheetFunction.Max(dblD)
  If dblMin > dblPL Then dblPL = dblMin
  If dblMax < dblPU Then dblPU = dblMax
  Dim sngP(1 To 5, 1 To 2) As Single
  sngP(1, 1) = ShapeX(cht, dblX - dblW / 2)
  sngP(1, 2) = ShapeY(cht, dblP25)
  sngP(2, 1) = ShapeX(cht, dblX + dblW / 2)
  sngP(2, 2) = ShapeY(cht, dblP25)
  sngP(3, 1) = ShapeX(cht, dblX + dblW / 2)
  sngP(3, 2) = ShapeY(cht, dblP75)
  sngP(4, 1) = ShapeX(cht, dblX - dblW / 2)
  sngP(4, 2) = ShapeY(cht, dblP75)
  sngP(5, 1) = ShapeX(cht, dblX - dblW / 2)
  sngP(5, 2) = ShapeY(cht, dblP25)
  Dim shp As Shape
  Set shp = cht.Shapes.AddPolyline(sngP)
  If bolGradient Then
    shp.Fill.ForeColor.RGB = RGB(255, 255, 255)
    shp.Fill.TwoColorGradient msoGradientHorizontal, 1
    shp.Fill.BackColor.RGB = RGB(intR, intG, intB)
    shp.Line.ForeColor.RGB = RGB(intR, intG, intB)
    shp.Line.Weight = 1.5
  Else
    shp.Fill.BackColor.RGB = RGB(intR, intG, intB)
    shp.Fill.Transparency = 0.5
    shp.Line.ForeColor.RGB = RGB(intR, intG, intB)
    shp.Line.Weight = 1.5
  End If

  Dim shp2 As Shape
  Dim bx As Double
  Dim by As Double
  Dim ex As Double
  Dim ey As Double
  bx = ShapeX(cht, dblX - dblW / 2)
  ex = ShapeX(cht, dblX + dblW / 2)
  by = ShapeY(cht, dblP50)
  ey = ShapeY(cht, dblP50)
  Set shp2 = cht.Shapes.AddLine(bx, by, ex, ey)
  shp2.Line.Weight = 1.5
  shp2.Line.ForeColor.RGB = RGB(intR, intG, intB)
  bx = ShapeX(cht, dblX)
  ex = ShapeX(cht, dblX)
  by = ShapeY(cht, dblP75)
  ey = ShapeY(cht, dblPU)
  Set shp2 = cht.Shapes.AddLine(bx, by, ex, ey)
  shp2.Line.Weight = 1.5
  shp2.Line.ForeColor.RGB = RGB(intR, intG, intB)

  bx = ShapeX(cht, CDbl(dblX))
  ex = ShapeX(cht, CDbl(dblX))
  by = ShapeY(cht, dblP25)
  ey = ShapeY(cht, dblPL)
  Set shp2 = cht.Shapes.AddLine(bx, by, ex, ey)
  shp2.Line.Weight = 1.5
  shp2.Line.ForeColor.RGB = RGB(intR, intG, intB)

  bx = ShapeX(cht, CDbl(dblX - dblW / 4))
  ex = ShapeX(cht, CDbl(dblX + dblW / 4))
  by = ShapeY(cht, dblPU)
  ey = ShapeY(cht, dblPU)
  Set shp2 = cht.Shapes.AddLine(bx, by, ex, ey)
  shp2.Line.Weight = 1.5
  shp2.Line.ForeColor.RGB = RGB(intR, intG, intB)

  bx = ShapeX(cht, CDbl(dblX - dblW / 4))
  ex = ShapeX(cht, CDbl(dblX + dblW / 4))
  by = ShapeY(cht, dblPL)
  ey = ShapeY(cht, dblPL)
  Set shp2 = cht.Shapes.AddLine(bx, by, ex, ey)
  shp2.Line.Weight = 1.5
  shp2.Line.ForeColor.RGB = RGB(intR, intG, intB)

  Dim xx As Double
  Dim yy As Double
  Dim ww As Double
  Dim hh As Double
  For intI = 1 To intN
    xx = ShapeX(cht, CDbl(dblX - dblW / 20))
    yy = ShapeY(cht, dblD(intI - 1))
    ww = cht.PlotArea.InsideWidth / (cht.Axes(1).MaximumScale - cht.Axes(1).MinimumScale) * dblW / 10
    hh = ww
    If dblD(intI - 1) > dblPU Or dblD(intI - 1) < dblPL Then
      Set shp2 = cht.Shapes.AddShape(92, xx, yy, ww, hh)
    End If
  Next
End Sub
简单箱形图叠加均值连线
箱形图上没有均值信息,所以,常常在一组箱形图上叠加连接均值得到的折线。
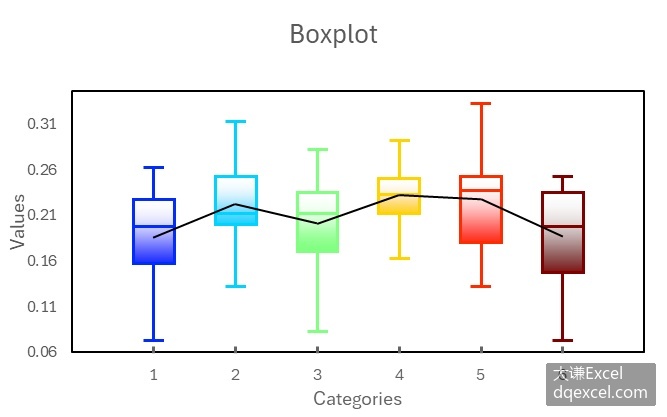
图5-13 箱形图叠加均值连线
使用Python xlwings实现时先计算各组数据的均值,然后利用这些均值绘制折线。完整代码见:Samples->ch08 统计图表->11 简单箱形图叠加均值连线->py.py。
Sub DrawBoxplot(dblD() As Double, intN As Integer, cht As Chart, intR As Integer, intG As Integer, intB As Integer, dblX As Double, dblW As Double, bolGradient As Boolean)
  '省略部分代码

  Dim sngP(1 To 5, 1 To 2) As Single
  sngP(1, 1) = ShapeX(cht, dblX - dblW / 2)
  sngP(1, 2) = ShapeY(cht, dblP25)
  sngP(2, 1) = ShapeX(cht, dblX + dblW / 2)
  sngP(2, 2) = ShapeY(cht, dblP25)
  sngP(3, 1) = ShapeX(cht, dblX + dblW / 2)
  sngP(3, 2) = ShapeY(cht, dblP75)
  sngP(4, 1) = ShapeX(cht, dblX - dblW / 2)
  sngP(4, 2) = ShapeY(cht, dblP75)
  sngP(5, 1) = ShapeX(cht, dblX - dblW / 2)
  sngP(5, 2) = ShapeY(cht, dblP25)
  Dim shp As Shape
  Set shp = cht.Shapes.AddPolyline(sngP)
  If bolGradient Then
    shp.Fill.ForeColor.RGB = RGB(intR, intG, intB)
    shp.Fill.OneColorGradient msoGradientHorizontal, 1, 1
    shp.Line.ForeColor.RGB = RGB(intR, intG, intB)
    shp.Line.Weight = 1.5
  Else
    shp.Fill.ForeColor.RGB = RGB(intR, intG, intB)
    shp.Fill.Transparency = 0.5
    shp.Line.ForeColor.RGB = RGB(intR, intG, intB)
    shp.Line.Weight = 1.5
  End If

  Dim shp2 As Shape
  Dim bx As Double
  Dim by As Double
  Dim ex As Double
  Dim ey As Double
  bx = ShapeX(cht, dblX - dblW / 2)
  ex = ShapeX(cht, dblX + dblW / 2)
  by = ShapeY(cht, dblP50)
  ey = ShapeY(cht, dblP50)
  Set shp2 = cht.Shapes.AddLine(bx, by, ex, ey)
  shp2.Line.Weight = 1.5
  shp2.Line.ForeColor.RGB = RGB(intR, intG, intB)
  bx = ShapeX(cht, dblX)
  ex = ShapeX(cht, dblX)
  by = ShapeY(cht, dblP75)
  ey = ShapeY(cht, dblPU)
  Set shp2 = cht.Shapes.AddLine(bx, by, ex, ey)
  shp2.Line.Weight = 1.5
  shp2.Line.ForeColor.RGB = RGB(intR, intG, intB)

  bx = ShapeX(cht, CDbl(dblX))
  ex = ShapeX(cht, CDbl(dblX))
  by = ShapeY(cht, dblP25)
  ey = ShapeY(cht, dblPL)
  Set shp2 = cht.Shapes.AddLine(bx, by, ex, ey)
  shp2.Line.Weight = 1.5
  shp2.Line.ForeColor.RGB = RGB(intR, intG, intB)

  bx = ShapeX(cht, CDbl(dblX - dblW / 4))
  ex = ShapeX(cht, CDbl(dblX + dblW / 4))
  by = ShapeY(cht, dblPU)
  ey = ShapeY(cht, dblPU)
  Set shp2 = cht.Shapes.AddLine(bx, by, ex, ey)
  shp2.Line.Weight = 1.5
  shp2.Line.ForeColor.RGB = RGB(intR, intG, intB)

  bx = ShapeX(cht, CDbl(dblX - dblW / 4))
  ex = ShapeX(cht, CDbl(dblX + dblW / 4))
  by = ShapeY(cht, dblPL)
  ey = ShapeY(cht, dblPL)
  Set shp2 = cht.Shapes.AddLine(bx, by, ex, ey)
  shp2.Line.Weight = 1.5
  shp2.Line.ForeColor.RGB = RGB(intR, intG, intB)

  Dim xx As Double
  Dim yy As Double
  Dim ww As Double
  Dim hh As Double
  For intI = 1 To intN
    xx = ShapeX(cht, CDbl(dblX - dblW / 20))
    yy = ShapeY(cht, dblD(intI - 1))
    ww = cht.PlotArea.InsideWidth / (cht.Axes(1).MaximumScale - cht.Axes(1).MinimumScale) * dblW / 10
    hh = ww
    If dblD(intI - 1) > dblPU Or dblD(intI - 1) < dblPL Then
      Set shp2 = cht.Shapes.AddShape(92, xx, yy, ww, hh)
    End If
  Next
End Sub
运行代码,生成的效果类似图5-13所示。
复合箱形图
复合箱形图用多组箱形序列表示多个分组的多组数据。如图5-14所示,颜色相同的箱形构成一个序列,相邻的不同颜色的箱形构成一个分组,图中有2个序列,6个分组。
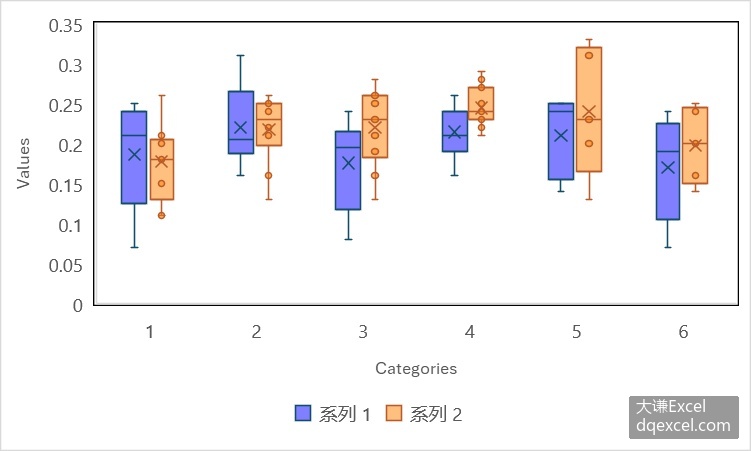
图5-14 复合箱形图
用Python xlwings无法直接绘制复合箱形图,需要按照5.2.2小节介绍的方法自己创建。按照该方法自己绘制两组简单箱形图即可,注意计算好它们的显示位置。[大谦Excel,dqexcel点com]